Awards
KPI Dashboard
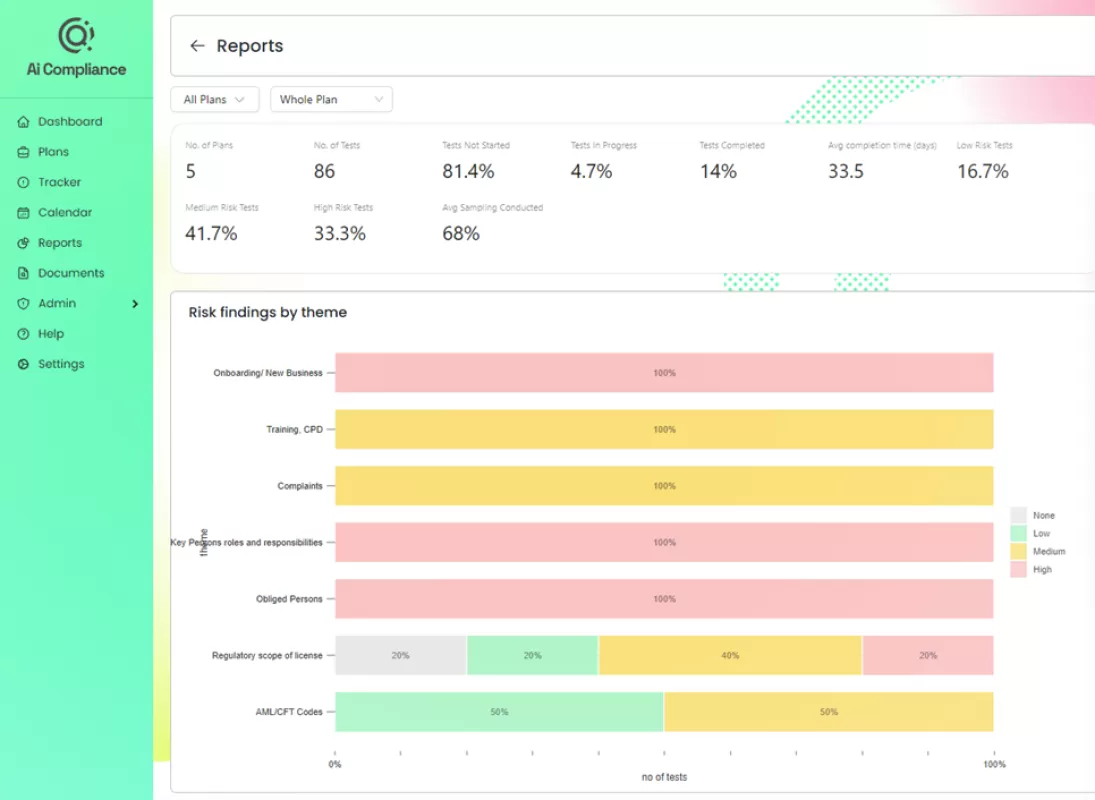
A KPI dashboard is a visual tool that displays key performance indicators (KPIs) in a clear and concise manner, providing a snapshot of an organization’s performance in real-time.

Multiple KPI Reporting
The KPI dashboard is a tool which unites the data sources within all the monitoring plans created or specifically selected monitoring plans, it provides a visual live position on how the business is performing. It can be broken down into specific period of review. Specific data on regulatory themes, risk positions, testing results and much more can all be recorded. No more filtering or drop downs to create manual graphs for board reporting.

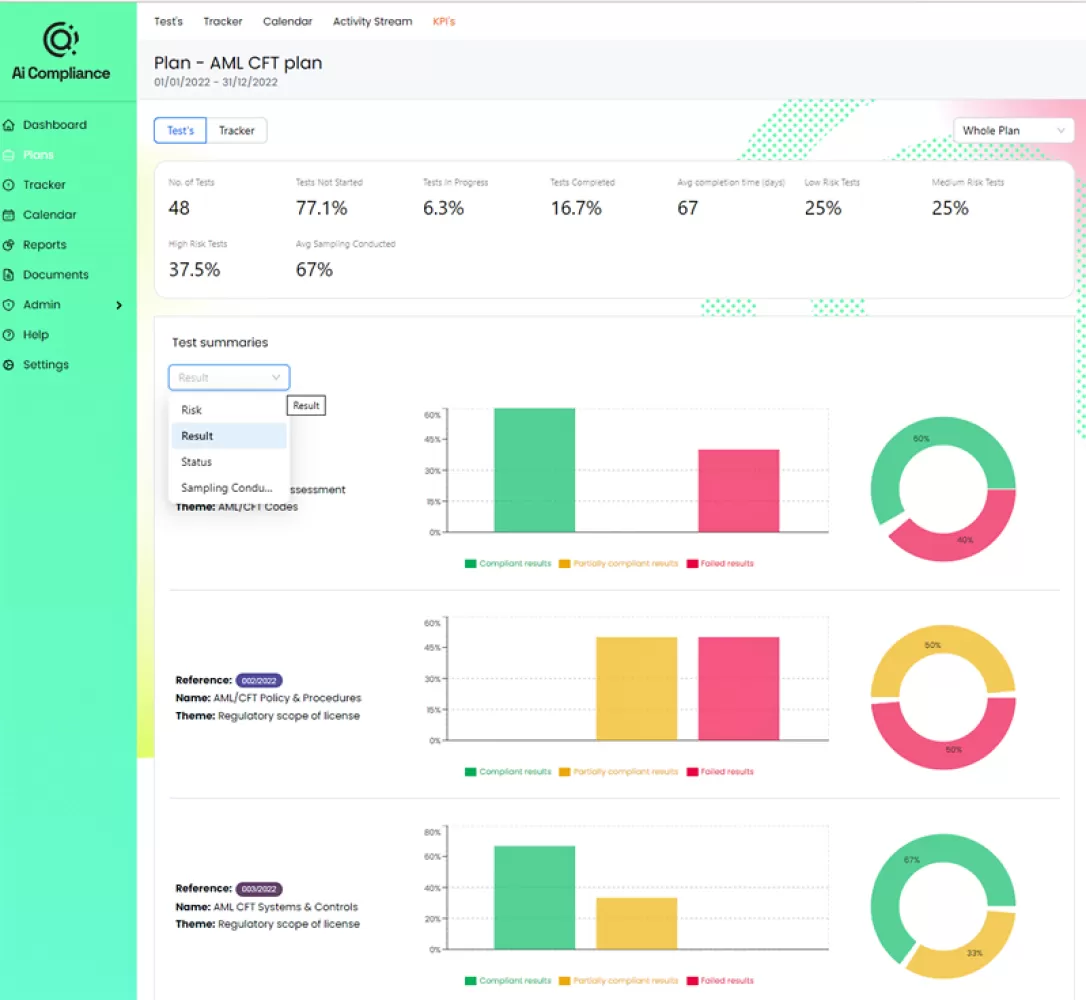
Individual plan KPI's
Key Performance Indicators are available for each monitoring plan created. live positions on testing conducted can be exported for reporting purposes. Having a live KPI dashboard connected to your company’s monitoring plan lets you know if your business needs to focus on a particular area to avoid losing time and money.

Regulatory Library
Our regulatory library is a collection of documents and information related to regulation and legislation applicable to all regulated financial service businesses in Jersey.
Remedial Actions Tracker
A remediation tracker is a tool used to monitor and track the progress of corrective actions taken to address compliance violations or operational deficiencies within a business, ensuring timely and effective resolution.
Multiple Plan Functionality
Multiple plan functionality allows a business to manage multiple plans relevant to your business, from the compliance monitoring plan, operational monitoring plan, and financial crime monitoring plan to an infinite number of funds monitoring plans.
